Garbage Collection
This line graph illustrates the ratio of Garbage Data to Total Data. Garbage collection reduces the required capacity in the object store, but it also introduces overhead to the on-premises compute and storage resources, as well as the network between the primary site and the storage site.
- The displayed time span of the graph can be adjusted from the selection menu in the upper left corner.
- Highlighting a point on the graph displays data from that specific point in time.
- The lower portion of the screen provides summary information.
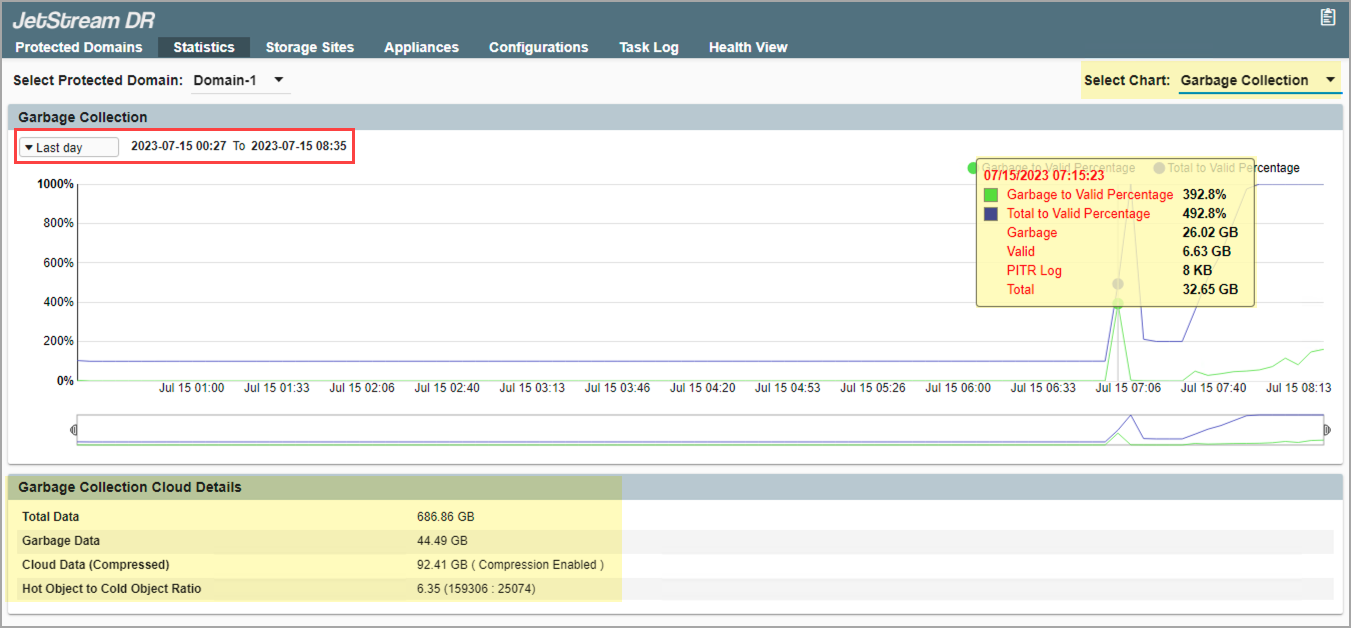
Figure 144: Garbage collection.