RPO (Recovery Point Objective)
The Recovery Point Objective chart is a histogram with 10 buckets (bars) representing different ranges of RPO. With a sufficiently robust network between the primary site and the storage site, RPO should usually fall within the 0s–5s range, but periods when RPO falls outside this goal are shown in the chart and can be used to diagnose network and other issues.
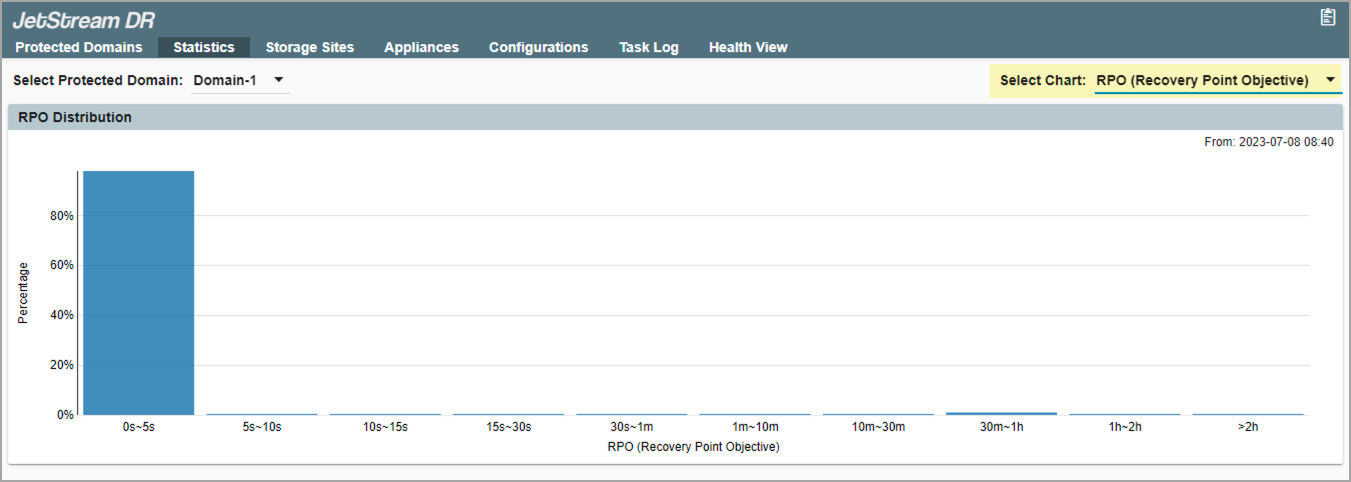
Recovery Point Objective (RPO).