Incoming & Outgoing Data Rate
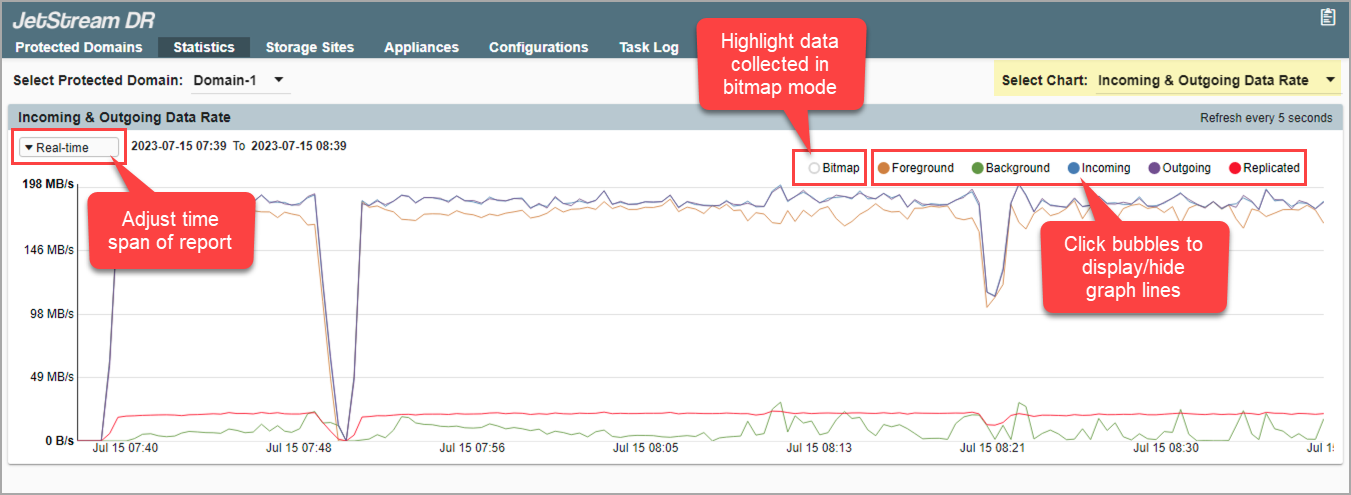
This line graph uses different colored lines and shading to provide information about various data flow rates. Individual graph elements can be displayed or hidden by toggling the control bubbles. The time span of the chart can be adjusted by making a selection from the menu in the upper left corner.
Data represented in the Incoming & Outgoing Data Rate chart are:
- Bitmap data: Highlights on the graph intervals during which data was collected in bitmap mode. (When the connection between the IO Filter and DRVA is interrupted, the IO Filter collects and maintains data in bitmap mode.)
- Foreground data: Draws a line showing data created by the protected VM that are being replicated to the storage site.
- Background data: Draws a line showing pre-existing data on the protected VM that are being transferred to the storage site.
- Incoming data (from IO Filter to DRVA): Draws a line representing data being transferred from the IO Filter to the DRVA. This shows the rate at which data is being written to the DRVA and replication log prior to transfer across the network to the object store.
- Outgoing data (from DRVA to object store before compression): Draws a line representing raw data being transferred from the DRVA.
- Replicated data (from DRVA to object store after compression): Draws a line representing the rate at which domain data is being replicated to the cloud object store. This provides insight into the performance of the network between the primary site and the storage site, and the efficiency with which data is written to the object store.