Cloud Data
The Cloud Data line graph provides insight into the consumption of object store storage space when the Point in Time Recovery (PITR) function is used.
- The displayed time span of the graph can be adjusted from the selection menu in the upper left corner.
- Highlighting a point on the graph displays data from that specific point in time about compressed Total Data and PITR Log Data in the cloud.
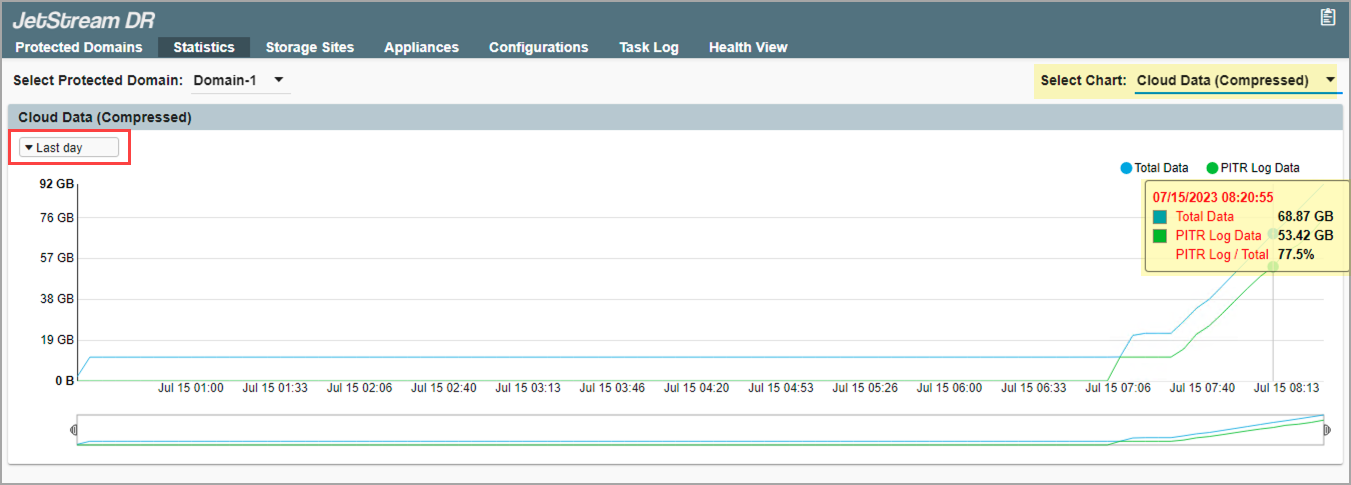
Figure 146: Cloud data consumption.