Cloud Data
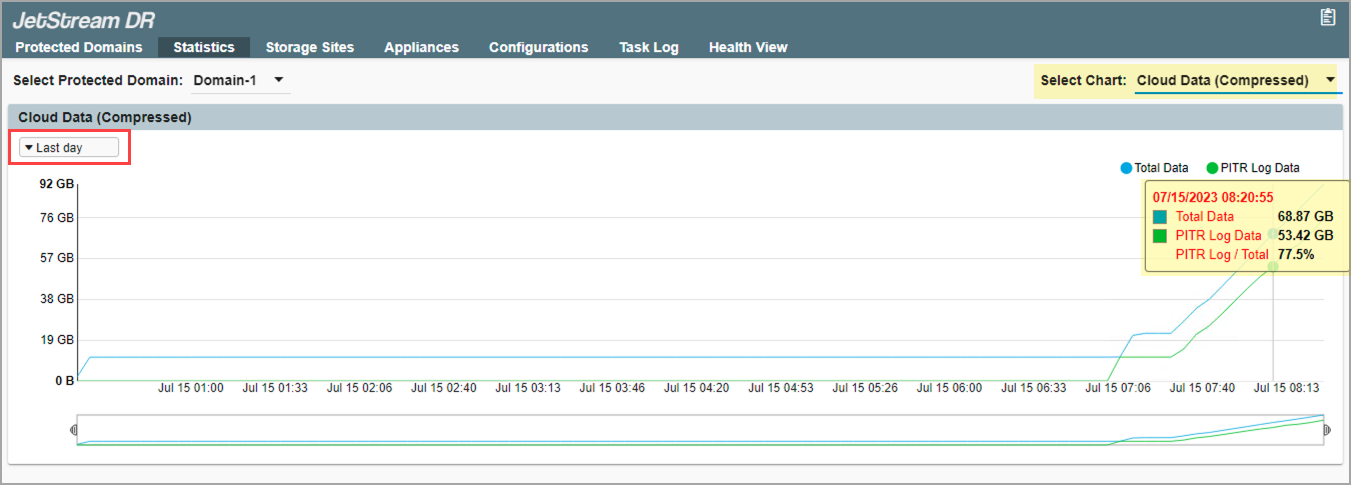
This line graph provides insight into the consumption of object store storage space when the Point in Time Recovery (PITR) function is used.
The displayed time span of the graph can be adjusted from the selection menu in the upper left corner. Highlighting a point on the graph displays data from that specific point in time about compressed Total Data and PITR Log Data in the cloud.