Replication Log
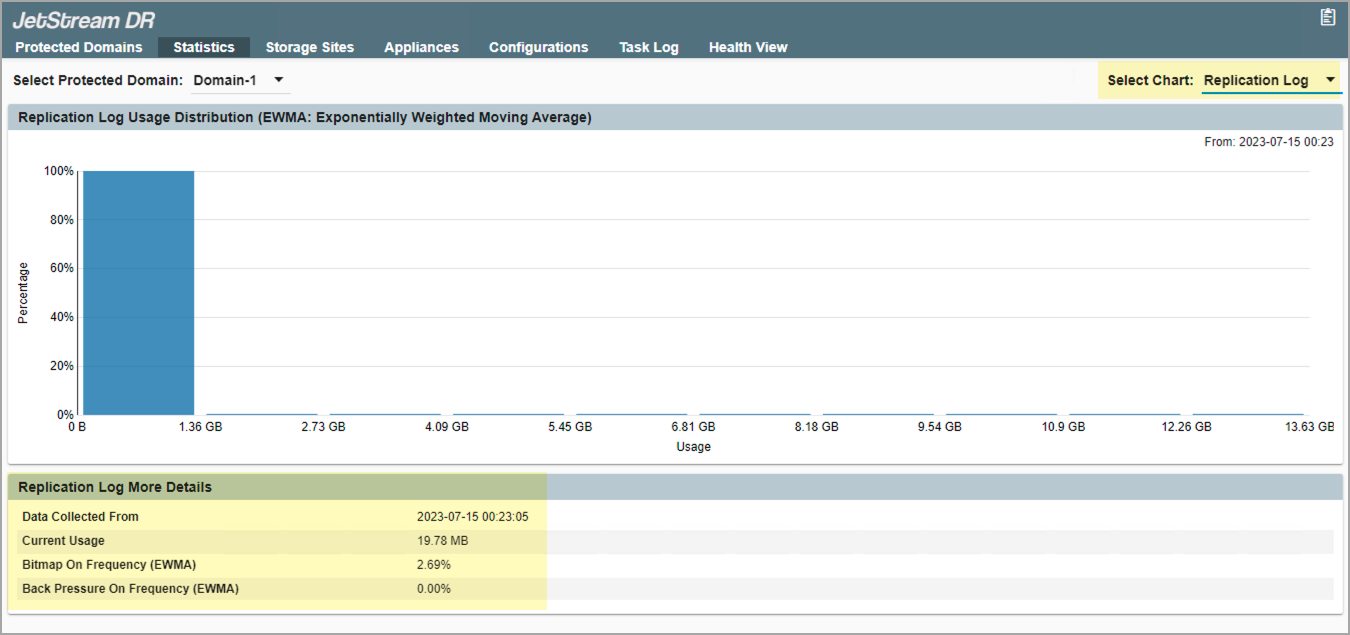
This histogram with 10 buckets (bars) represents amounts of data handled by the replication log. If the replication log becomes saturated (indicated by buckets filling on the right side of the screen) system performance will suffer; any underlying issues should be addressed to correct the issue.
The lower portion of the screen provides additional details about the replication log:
- Data Collected From: The time span during which data was collected.
- Current Usage: Size of the log at present.
- Bitmap On Frequency: Percentage of operating time that data could not efficiently reach the DRVA, so newly written data was captured by the IO Filters in bitmaps for later replication.
- Back Pressure On Frequency: Percentage of operating time that application write operations were slowed to accommodate data replication.