Replication Channel (Network Performance)
JetStream DR software is designed to gracefully handle replication performance issues related to the outgoing channel of protected VMs becoming slow or temporarily unavailable, or protected VMs from generating excessive network traffic.
Under normal circumstances JSDR applies minimal delay to ongoing IO and replicates data without incurring additional writes to the replication log. If the incoming data rate exceeds the outgoing bandwidth, JSDR begins populating the replication log with the expectation that data will be replicated after the usage spike on the protected VM comes down. If the incoming data rate in unusually large or the replication log of the domain is close to 100% capacity, some backpressure may be applied to the incoming data stream to slow it down. If the backpressure parameters are exceed, JSDR will switch to a bitmap protocol mode allowing the protected VM usage spike to fade off while minimally loading the outgoing replication channel. Because the cause of the network bandwidth problem is not exposed to JSDR and it has no specific knowledge of the duration of the event, JSDR will periodically exit bitmap mode and resume regular replication to validate network performance and will switch back to bitmap mode if necessary.
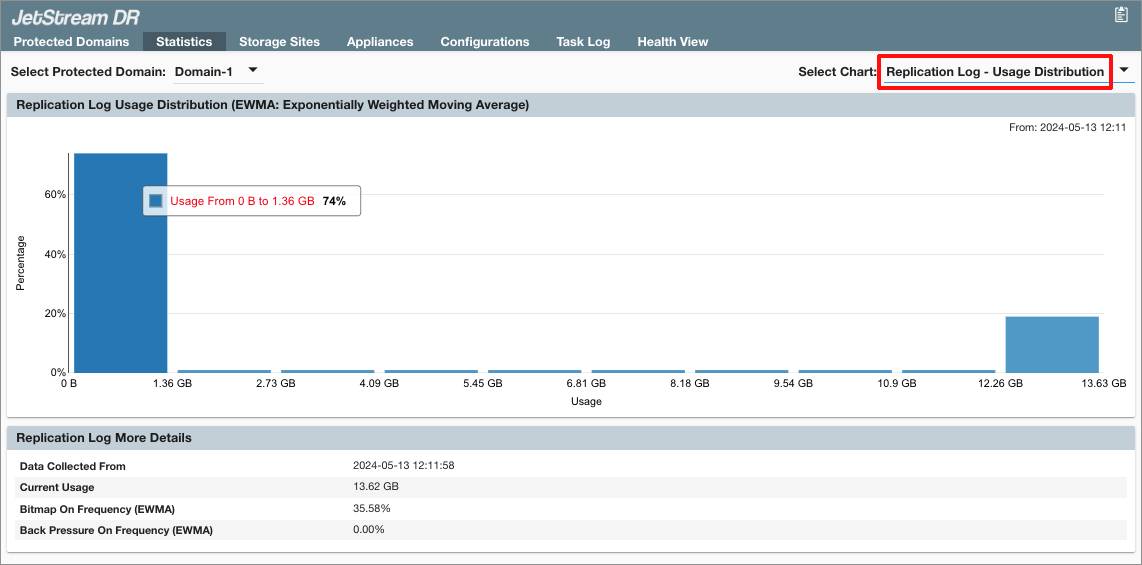
Example: Usage Distribution of domain with replication log 100% full.
- The Incoming & Outgoing Data Rate report under the Statistics tab of the JSDR UI shows time spans when the domain was running in bitmap mode. To highlight periods on the graph when bitmap mode was engaged, click the Bitmap circle icon at the top of the chart.
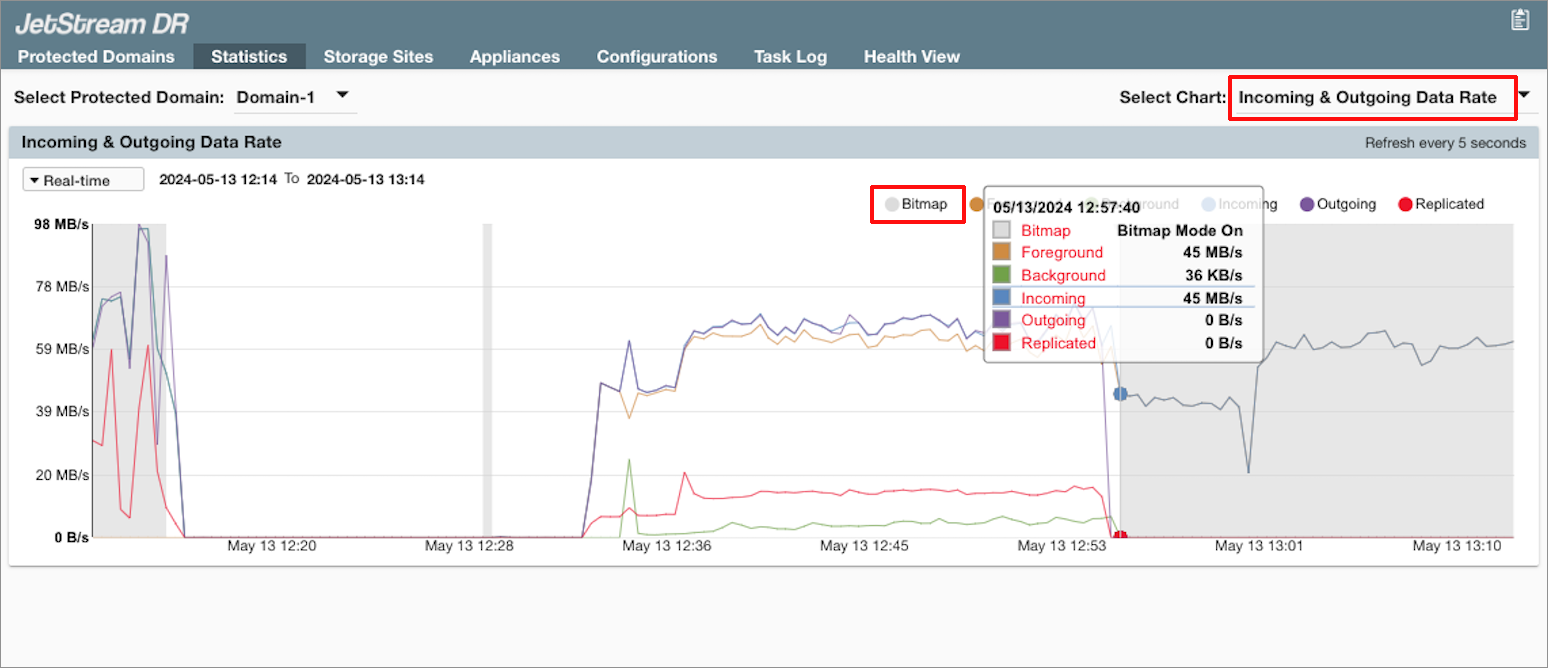
Graph showing when Bitmap mode was engaged.
- The actual number of operations delayed due to backpressure are displayed on the Backpressure report under the Statistics tab of the JSDR UI.
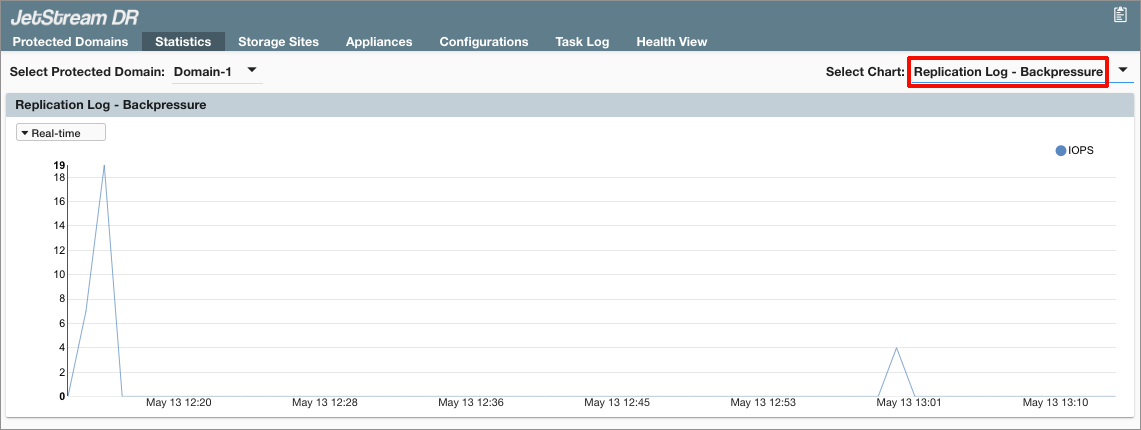
Graph showing number of operations delayed by backpressure.
- The PUT Object Latency report provides insight allowing performance of the outgoing replication channel to be analyzed.
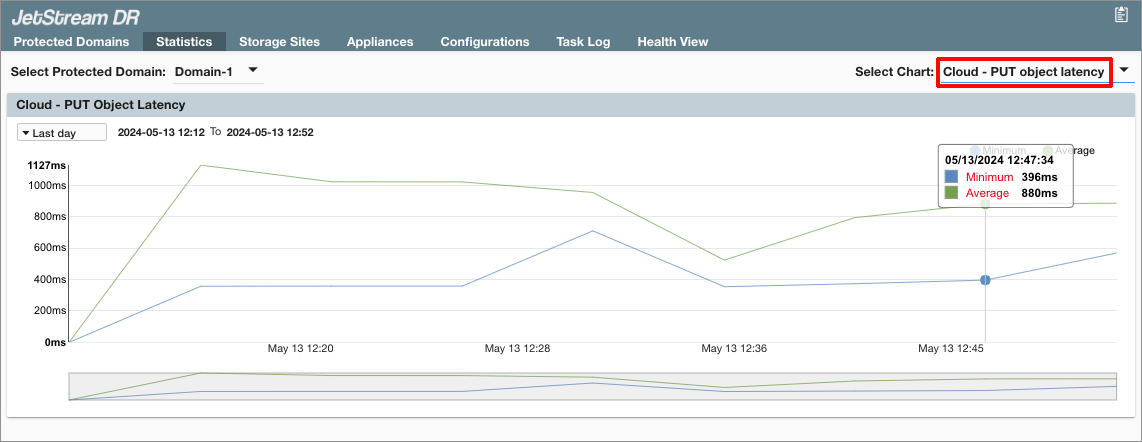
Analyzing performance of outgoing replication channel.