Monitoring Statistics
JetStream DR offers various metrics reports. By observing metrics, users can have a good understanding of the overall operation and performance of JetStream DR software across the Protected Domain.
- Go to the Statistics screen to access reports about the site.
- Select individual reports to view from the Select Chart menu.
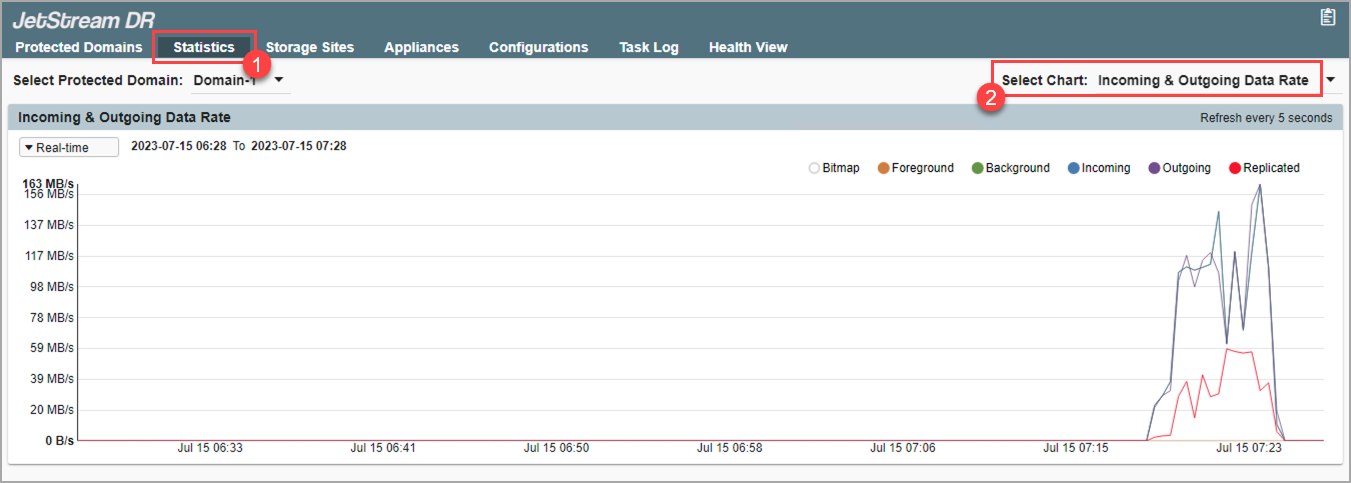
Figure 141: Observe the performance of JetStream DR software.
Also see:
Incoming and Outgoing Data Rate Report
RPO (Recovery Point Objective) Report
Replication Log Backpressure Report
Cloud PUT Object Latency Report